Finally in Morocco! The expertise of mineralogical characterization to optimize your resources
We offer mineralogical analysis by :
X-ray Diffraction - XRD
X-ray diffraction allows for the identification and semi-quantification of crystallized (non-amorphous) minerals in a sample. It is a fast and inexpensive technique to complement mineralogical analysis by light microscopy, especially for very fine-grained samples (difficult to study by light microscopy). Results obtained by XRD can be correlated with chemical analyses to cross-interpret chemical and mineralogical data. Mincape has developed its own algorithm that allows very reliable correlation of data.
The accuracy of the DRX method is in the range of ± 0.5 to 1% mass and requires a very fine particle size (less than 10 µm).
Typical usage:
-
- – Allows identification and quantification of minerals (semi-quantification)
- – Allows you to study the crystallinity of minerals
- – Widely used method for clay analysis
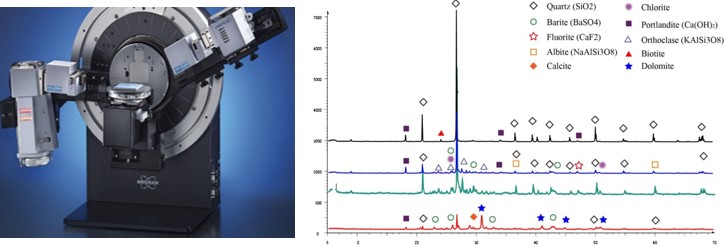
The diffractometer consists in bombarding the sample with a beam of X-rays by varying the angle of incidence (θ). Upon contact with the sample, the X-rays are diffracted according to Bragg’s law (nλ=2dsinθ) and collected by the detector of the apparatus. Knowing the wavelength (λ) of the incident beam (usually generated by a Co or Cu anticathode) and the diffraction angle (θ), we can calculate the inter-atomic distances (d) specific to each mineral, and thus identify the mineral or minerals present in the sample. Indeed, a mineral is made of an assembly of atoms arranged in planes which are repeated in the three dimensions of space and are separated from each other by a distance (d). The set of planes constitutes the crystal lattice which is characteristic to each mineral.
The reflected X-rays are recorded in the form of a diagram called diffractogram, which consists of peaks. For each mineral, one or more peaks corresponding to the different atomic planes of the mineral are recorded. The height of these peaks is proportional to the intensity of the diffraction and thus to the concentration of the mineral in the sample.
Before the samples are submitted to X-ray diffraction analysis, a pulverization is performed in isopropyl alcohol in a vibrating micronizer with corundum grinding bodies. This reduces the size of the minerals to about 10 µm.
Light microscopy
The optical microscope allows a qualitative description of the mineralogical composition of a sample and its texture.
Typical use:
-
- – identification of minerals
- – description of mineral texture
- – description of mineral associations and qualitative estimation of their release
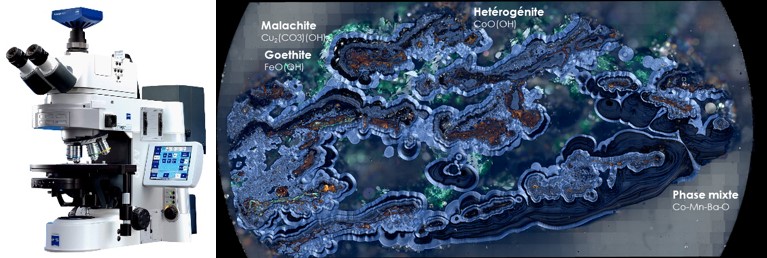
The mineralogical study is of capital importance in the mining field, that is why it must be very precise. It generally begins with a study with the optical microscope for the important number of information that this tool is able to bring (the skill of the experimenter is capital). Mineralogical identification is based on the capacity of minerals to react with light. In the case of the optical microscope, it is the transmitted light for transparent minerals (silicates, carbonates, etc), and the incident light for opaque minerals (sulfides, oxides and hydroxides). The identification of minerals under the optical microscope consists in the determination of certain properties of minerals such as color, shape, pleochroism, (bi)refringence, extinction angle, optical sign (transparent minerals), (bi)reflectance, anisotropy and reflectivity (opaque minerals). Other physical properties are exploited like relief, cleavage, hardness to polishing, internal reflections, etc.
In any mineralogical characterization study, the optical microscope allows a preliminary study of great importance which leads to an identification of the mineral phases, to describe their size and mixture and allows to target the zones of interest (on the scale of the mineral or the site) to be studied in more detail with other advanced techniques which allow complementary characterizations and to exceed the limits of the microscopic study which is especially qualitative.
There are about 300 opaque minerals and among them, a very large majority presents similar shades of gray that do not allow the identification of minerals even by direct comparison of grains side by side. The problem is even more difficult in the case of crushed ores and mine rejects where the minerals have a size of a few tens of microns and are dispersed in the resin. The grain size of these materials makes the study of their optical properties difficult because of the low spatial resolution of the microscope optics and their limited magnification (about 1000X). For higher magnifications and the observation of relevant details, it is necessary to use the electron microscope which reaches much higher magnifications (300 to 1 000 000 X).
In addition, the traditional optical microscope has recently benefited from the use of new techniques allowing to exploit other properties of the matter than the optical ones (infrared and Raman spectrometry). The microscope equipped with a CCD camera connected to a computer, for the recording of images and their computer processing, can also become a relatively powerful instrument of mineralogical quantification (multispectral imaging) but the developments in this field remain still not conclusive.
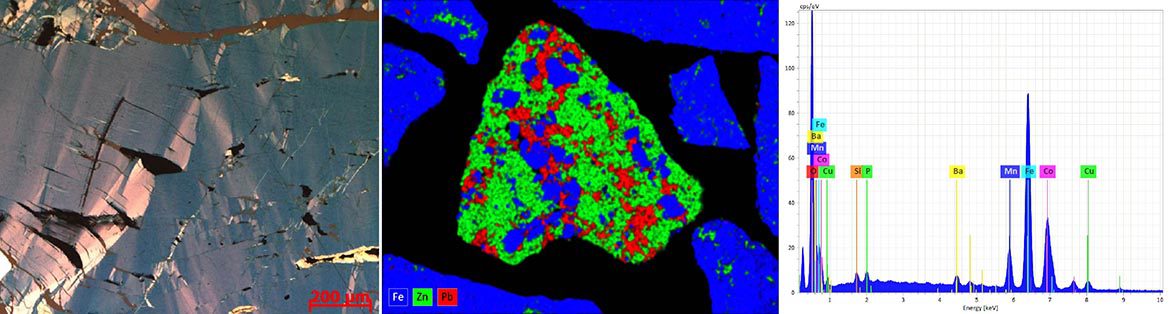
Electron microscopy
The electron microscope can assist in the identification of minerals by elemental micro-analysis using energy or wavelength dispersive spectrometers.
Typical Use:
-
- – identification of minerals by determination of their stoichiometry by elemental micro-analysis
- – determination of mineral morphology
- – quantification of minerals by highly sophisticated software
- – microanalysis accuracy is on the order of 0.1% mass
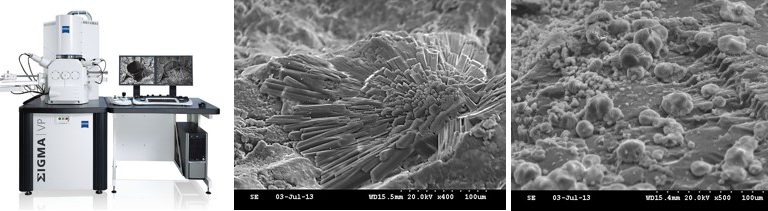
Mineralogical identification by optical microscope can sometimes be imprecise when some minerals are very fine and present optical properties that are very difficult to study. In this case, the SEM is often solicited to help in mineralogical identification. It is one of the most used tools in earth and material science. Its interest lies in the fact that it allows to study simultaneously the morphology and the chemical composition of materials.
Its operating principle consists in sending a beam of electrons onto the sample, placed in a vacuum chamber, which are extracted from a tungsten or lanthanum hexaboride (LaB6) filament by applying a high voltage. When the electron beam enters the sample, it scatters in a volume called the scattering bulb (~1 µm³). Incident electrons can undergo two types of interactions upon contact with the sample: i) elastic where they collide with the sample atoms and exit without losing energy (or low loss). These are backscattered electrons that originate from a fairly deep region of the sample (100 to 200 nm,). In the backscattered electron mode, minerals with a high atomic number (Z) (sulfides, sulfosalts, metals, etc) appear brighter than those with a low atomic number (gangue minerals such as silicates and carbonates, etc). It is this chemical contrast that is highly valued for distinguishing minerals from each other and is used for their identification and quantification under the SEM; ii) inelastic: there is a transfer of energy from the incident electrons to the atoms of the sample and one obtains: 1) secondary electrons that come from the surface layers and allow visualization of the topography of the sample with great depth of field; 2) Auger and X-ray electrons. Indeed, when an atom is bombarded by the high energy electron beam, an ionization occurs and an electron from a deep layer is ejected. This electron is replaced by an electron from a higher layer and an X-ray photon is emitted. X-ray analysis provides information about the chemical composition of the sample. Sometimes, part of the energy of X-ray photons can be transmitted to an electron of an external orbit which is ejected, it is an Auger electron. It has a very low energy and is characteristic of the atom that emitted it (used in Auger Spectrometry).
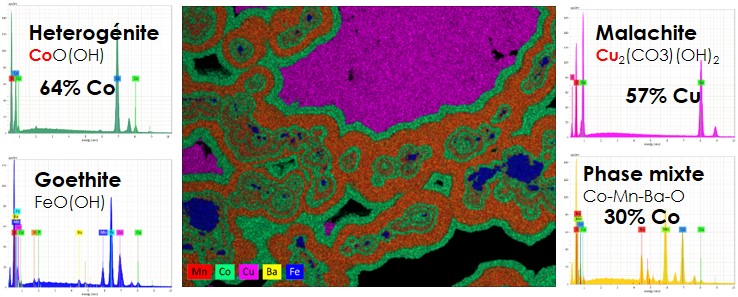
The SEM becomes a tool for chemical analysis when it is equipped with a detector that records X-rays in energy dispersion (EDS) or wavelength dispersion (WDS). The acquisition of the chemical composition of the sample can be done on the whole surface of the image (global chemical analysis or elementary X-ray mapping) or in a punctual way (micro-analysis).
Automated mineralogy system
The automated mineralogy system allows the quantification of several parameters that are very useful in ore processing.
Typical usage:
-
- – Mineralogical quantification of mineralsof interest and gangue (modal mineralogy)
- – Determination of the overall chemistry of a sample (calculated assay)
- – Elemental speciation of target metals (element deportment)
- – Quantification of mineralogical associations
- – Quantification of release (area and perimeter) of minerals of interest
- – Determination of grain size and grain mineralogy
- – Understanding and solving problems encountered in ore processing circuits
- – Search for bright phases such as gold, Ag and platinum group metals (PGMs)
- – Prediction of environmental impacts
- – Identification of critical penalizers in an ore
Automated mineralogy refers to a highly sophisticated analytical solution based on a scanning electron microscope (SEM) coupled with one or more energy dispersive X-ray spectrometers (EDS or EDX). The system is driven with software specifically developed to provide a largely automated and quantitative analysis of minerals in rocks and ores.
The Mincape laboratory provides automated mineralogy using a system based on a very high resolution Zeiss field effect electron microscope (FEG). It is equipped with two 30 mm2 Silicon Drift Detector EDS spectrometers from Bruker xFlash 6. The system is driven by the software “Mincape mining v1.06”.
Using this Automated Mineralogy system, the Mincape laboratory assists its clients in strategic mine planning and offers different levels of service depending on the project requirements. The advice provided helps to predict the operational performance of the processing plant (increase in raw material recovery), identify in advance the potential value of mineral losses to make key decisions in time and move the mining business forward with reliable data.
Today, automated mineralogy is applied throughout the raw materials value chain in all fields of application such as exploration, mining, beneficiation, environmental characterization, and reclamation of mine waste. In the field of mining, the main advantage of the automated characterization of materials lies in the precise determination of the mineralogical parameters mentioned above.
Some examples of results obtained by the automated mineralogy system:
Mineralogical quantification:
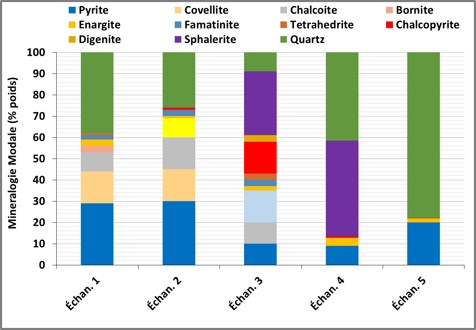
The automated mineralogy system allows the quantification of major and trace minerals present in samples based on elemental microanalysis (Zeiss Mincape Mining) or by comparison of EDS spectra (QEMSCAN, MLA, TIMA). For the Zeiss “Mincape Mining” automated mineralogy system that the Mincape laboratory uses, ceach EDS analysis in the form of elemental percentage (stoichiometry) is compared to an easily adjustable internal database. The graph below shows an example of the mineralogical quantification results.
Calculating the overall chemistry of a sample (Calculated assay)
Once the quantification of the minerals is determined by the automated mineralogy system, the overall chemistry of the sample can be calculated using the stoichiometry of each mineral previously determined by EDS. The concentration C(i,e) of an element (i) in the sample (e) is given by the equation below which represents the sum of the products of the concentration C(i,m) of element (i) in mineral (m) by the percentage p(m) of mineral (m) in the sample.
C(i,e) = sum [ C(i,m) * p(m) ]
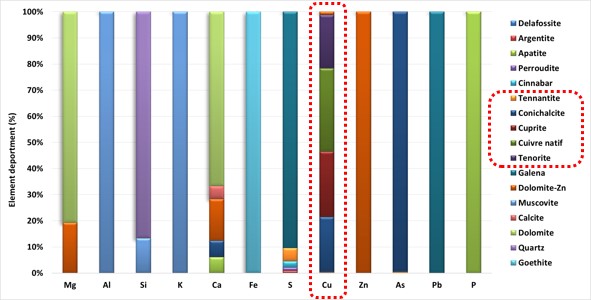
Elemental speciation of target metals (Element deportment)
Elemental speciation or elemental deportment consists of determining the distribution of a chemical element of interest (Cu, Pb, Zn, Ag, Sb, Sn, W, ect) among the different minerals in the sample.
In the graph below, obtained by the “Mincape Mining” software, we can see the example of a mine where copper is shared between cuprite (25%), tenorite (20%), native copper (32%), conichalcite (22%) and tennantite (1%). This mine loses between 20 to 25% of the Cu that it cannot recover by flotation because it is associated with conichalcite.
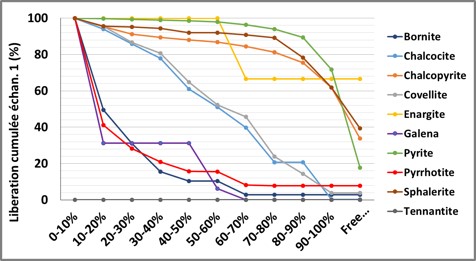
Mineral Release
Automated mineralogy quantifies the release of minerals carrying chemical elements of interest (Cu, Pb, Zn, Ag, Sb, Sn, W, etc) to evaluate their recovery potential in a processing circuit. The release can be expressed as a percentage of the exposed surface or the exposed perimeter. As shown in the two graphs below, one can visualize the release of a mineral (here chalcopyrite) in the different samples of a processing circuit, or visualize the release of all minerals in a given sample.

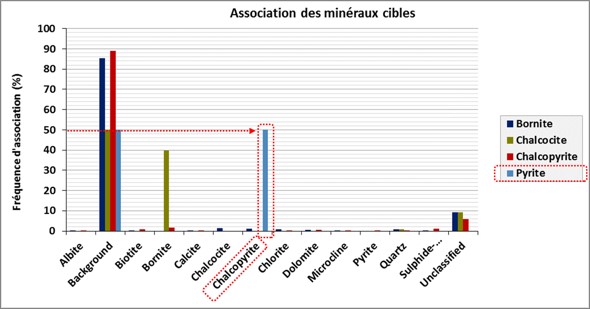
Mineral association
Automated mineralogy allows the quantification of associations between different minerals in a sample. In the graph below, we can read that in 50% of the observations, chalcopyrite is associated with pyrite.
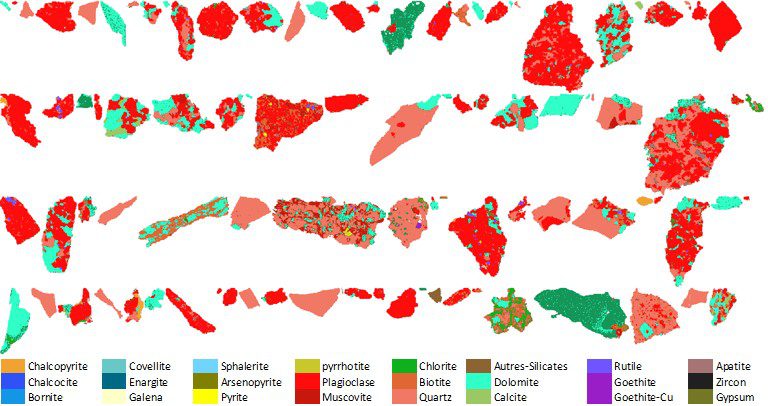
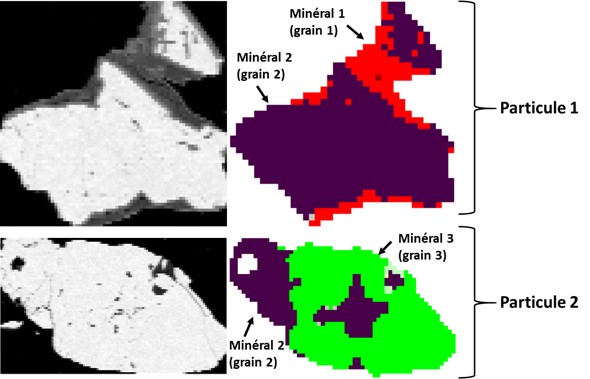
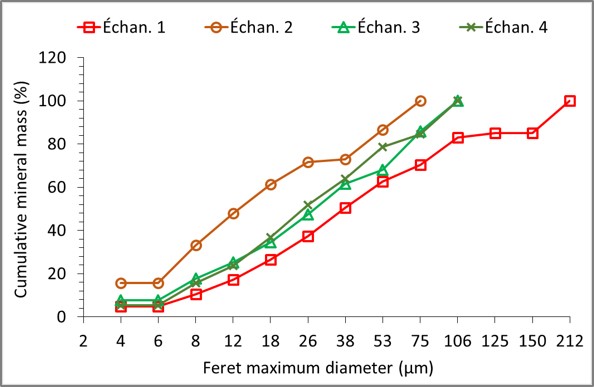
Mineral particle size distribution
Automated mineralogy allows for the determination of the per particle size distribution, which is made up of several minerals (usually referred to as grains in automated mineralogy), or per grain (or mineral) as shown in the figure below. The particle size distribution per grain or mineral gives what is usually called granulo-mineralogy.
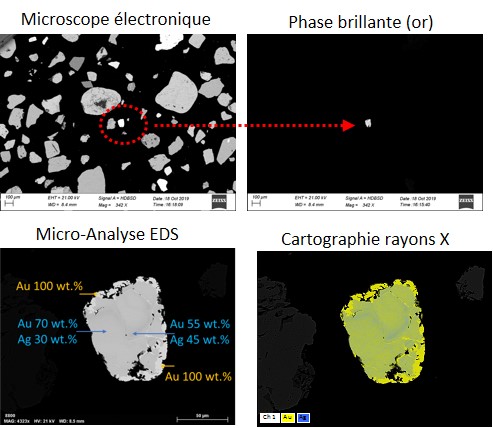
Bright Phase Search (Bright Phase Search)
The Automated Mineralogy System provides a fully automated search for precious metals such as gold, Ag and platinum group metals (PGMs). The system is programmed to display only these very bright metals under the electron microscope in backscattered electron mode, as shown in the figure below. During the analysis, the system stops whenever it encounters a bright phase, takes its image and analyzes it according to a user-defined mode.
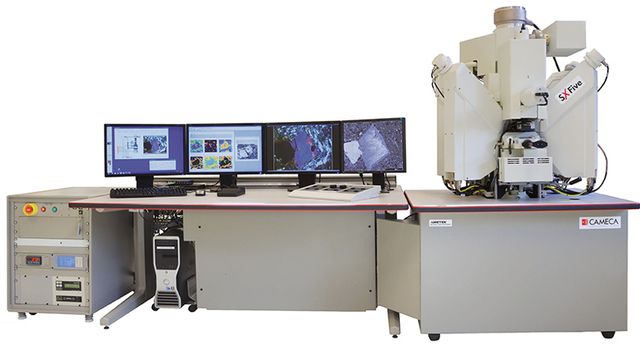
Electronic microprobe
The electron microprobe is specifically dedicated to the microanalysis of minerals using up to wavelength dispersive spectrometers that achieve up to 50 times more accurate analysis than SEM.
Typical Uses:
-
- – Identification of minerals by determining their stoichiometry with high accuracy
- – Enables elemental mapping with very high resolution
- – microanalysis accuracy is on the order of 50 mass ppm
1ppm = 1 mg/kg = 1 gram/ton = 0.0001 mass %
The laboratory Mincape has the possibility, through a long collaboration with its partners specialized in microanalysis by electron microprobe, to offer this type of investigation on any type of mining samples, especially gold ores.
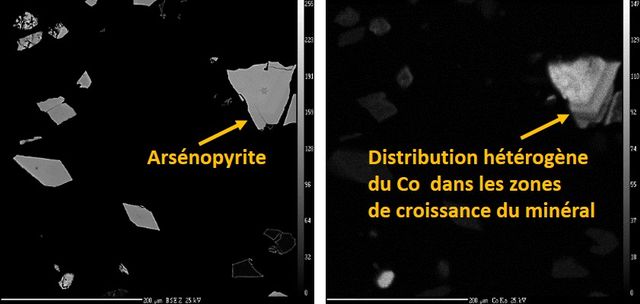
The principle of operation of the Electron Microprobe is identical to that of the electron microscope and allows the same types of investigations using secondary electrons, backscattered electrons, and X-rays allowing for very precise elemental mapping and microanalysis. The electron microprobe is essentially dedicated to the elemental chemical analysis of minerals with a very good precision having a detection limit that can go down to a few tens of ppm. The accuracy of the microprobe is linked to i) the use of a wavelength dispersion detector (WDS) and ii) the use of standards for which an acquisition is performed just before the analysis of the sample to calibrate the machine. The WDS spectrometer exploits Bragg’s law (nλ=2dsinθ) which allows the determination of the wavelength (λ) of the X-rays emitted by the analyzed mineral, knowing the (d) of the crystal monochromator and its angle (θ).
The electron microprobe, like the electron microscope, is used for exploration, mining, ore processing, environmental characterization, and reclamation of mine waste. It allows analyses with much lower detection limits for the determination of trace elements (Cd, As, Ni, Sb, etc.) in minerals. It is a particularly interesting analytical tool for the analysis of refractory gold in sulfides when the contents are a few dozen to a few hundred ppm.
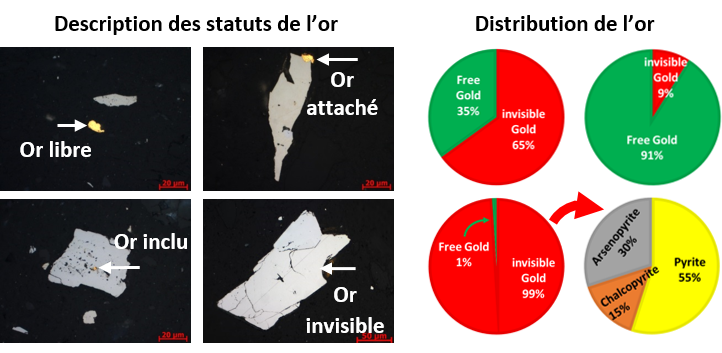
The Mincape lab offers very detailed characterization of gold. It can assess the different statuses of gold: free, attached, included and invisible as shown in the figure below.
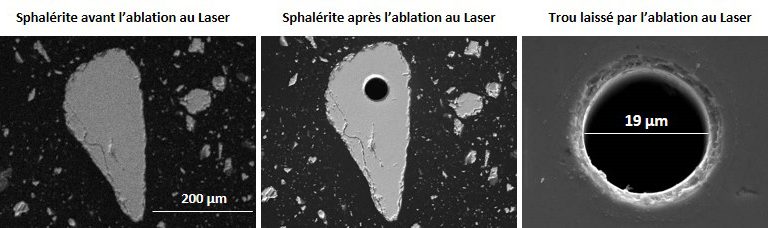
Laser ablation coupled to ICP-MS
Laser ablation coupled with ICP-MS analysis, commonly referred to as LA-ICP-MS, allows for more accurate microanalysis than electron microprobe for trace metals. The precision of the technique lies in the use of a mass spectrometer.
Typical use :
-
- – Microanalysis of minerals for precious elements (Au, Ag, PGM)
- – Elemental mapping for trace levels
- – microanalysis accuracy is in the range of a few ppm to a few mass ppb
1 ppm = 1 mg/kg = 1 gram/ton = 0.0001 mass %
1 ppb = 0.001 ppm = 0.001 mg/kg = 0.001 gram/ton = 0.0000001 mass %
The laboratory Mincape has the possibility, through a long collaboration with its partners specialized in micro-analysis by Laser ablation, to offer this type of investigation on any type of mining samples, especially gold ores.
Some trace chemicals may be in quantities even lower than the detection limit of the electron microprobe, so in the order of a few ppm (parts per million) or a few ppb (parts per billion). To detect them, we can use microanalysis techniques that have very low elemental detection limits, such as the ion microprobe or laser ablation, both coupled to a mass spectrometer. The ion microprobe is a very expensive technique and very little available compared to laser ablation.
Laser ablation is becoming more and more popular and accessible in mineralogical analysis laboratories. It is thus much solicited for the determination of trace elements in ores for mining exploration and the search for precious metals and for metallurgical processes. This technique consists in bombarding the mineral by a focused and very high energy laser beam. The mineral is then pulverized at the point of impact of the laser (a few microns) and the micro-fragments of the mineral (particle vapour) are entrained by argon in an ICP plasma torch and are analyzed by a mass spectrometer (ICP-MS).